

a.s.r. manages its business primarily using operational key performance indicators (KPIs). The operating result is the KPI covering the overall profitability of the business. Furthermore, a.s.r. uses other operational measures such as the Non-Life ratio, the life operating expenses as well as the availability and creation of capital, based on the Solvency II partial internal model, as key figures in business decision making (see chapter 7.9).
The operating result is managed and presented at the consolidated a.s.r. and at a segment level (see chapter 7.4.3) and is also a key profitability indicator at business line level. The operating result is an inclusive measure covering all result components that can be influenced by the regular business. As such the operating result is the single bottom line performance indicator covering the performance of the business.
Operating result as presented below is an Alternative Performance Measure (non-GAAP financial measure) and is not a measure of financial performance under IFRS. Because it is not determined in accordance with IFRS, operating result as presented by a.s.r. may not be comparable to other similarly titled measures of performance of other companies.
Definition of operating result
The definition of operating result has changed due to the introduction of IFRS 17.
Operating result is calculated by using the result before tax from continuing operations reported in accordance with IFRS, adjusted for the following:
1. Adjustments to the investment and finance result: investment and finance result, excluding investment operating expenses, is replaced by an Operating Investment and Finance Result (which is part of the Operating Result) which is defined as the expected return on the investments in excess of the expected interest accrual on the insurance liabilities, the investment operating expenses, all hybrid expenses (including hybrid expenses through OCI) and the UFR drag for each reporting period.
The operating result should reflect the operational performance of a.s.r. and should exclude revaluation effects on the assets and (insurance related) liabilities as a result of interest and spread movements and/or equity and real estate market movements.
If a.s.r. is to value the present value of future cash flows, it is common market practice to make use of a forward curve (based on the current discount curve) plus a certain premium reflecting the risk of invested assets. This premium is defined as the implied spread at the beginning of the period over which the result is calculated.
The expected return is calculated as:
For the fixed income investments: the market value of the fixed income assets at the beginning of the period multiplied by the total of the one year forward swap rate and the implied spread at the beginning of the period;
For equities and real estate investments: the market value of the equity and real estate assets at the beginning of the period multiplied by a total return assumption;
For Insurance related liabilities: the market value of the insurance related liabilities at the beginning of the period multiplied by the one-year forward rate of the IFRS17 curve (i.e. including the Liability Illiquidity Premium and Credit Risk Adjustment);
The other assets / liabilities at the beginning of the period multiplied by the forward curve.
The implied spread per fixed income asset category is defined as the required increase above the forward swap curve to determine the current market value. The implied spreads are calculated quarterly. a.s.r. has defined five fixed income asset categories that each have an implied spread.
The balance sheet at the beginning of the period is based on a.s.r.’s look-through principle, i.e. all assets in the same asset category have a similar risk-profile (e.g. fixed income funds are classified as fixed income and not as equities, real estate funds are classified as real estate, etc.).
For real estate and equity investments, a.s.r. applies a total return assumption of 5.5% and 6.6% (pre-tax) respectively. This assumption is evaluated each year;
2. The impact of changes to future services on onerous contracts. This implies that the negative impact of onerous contracts solely have an impact on the operating result at initial recognition;
3. The impact of changes of inflation on the Liability for Incurred Claims;
4. Other adjustments and incidental items:
Model- and methodological changes of a fundamental nature, in the measurement of the insurance liabilities;
Results of non-core operations;
Non-recurring or one-off items related to the ongoing business;
Non-recurring or one-off items not related to the ongoing business, such as (non-exhaustive) restructuring costs, regulatory costs not related to business activities, changes in own pension arrangements and expenses related to mergers and acquisitions (M&A) activities and start-ups.
The RoE, which is based on the operating result, is defined as:
The operating result adjusted for the applicable tax divided by
The IFRS equity adjusted for the unrealised capital gains reserve that may be reclassified subsequently to profit or loss and equity components of non-core activities.
Historical comparison
a.s.r. introduced the operating result in 2015 prior to the IPO. The operating result has since been the KPI for managing the profitability of the business. The comparison under IFRS 4 (2015-2022) and IFRS 17 (2022-2023) is shown separately.
IFRS 4 result versus operating result
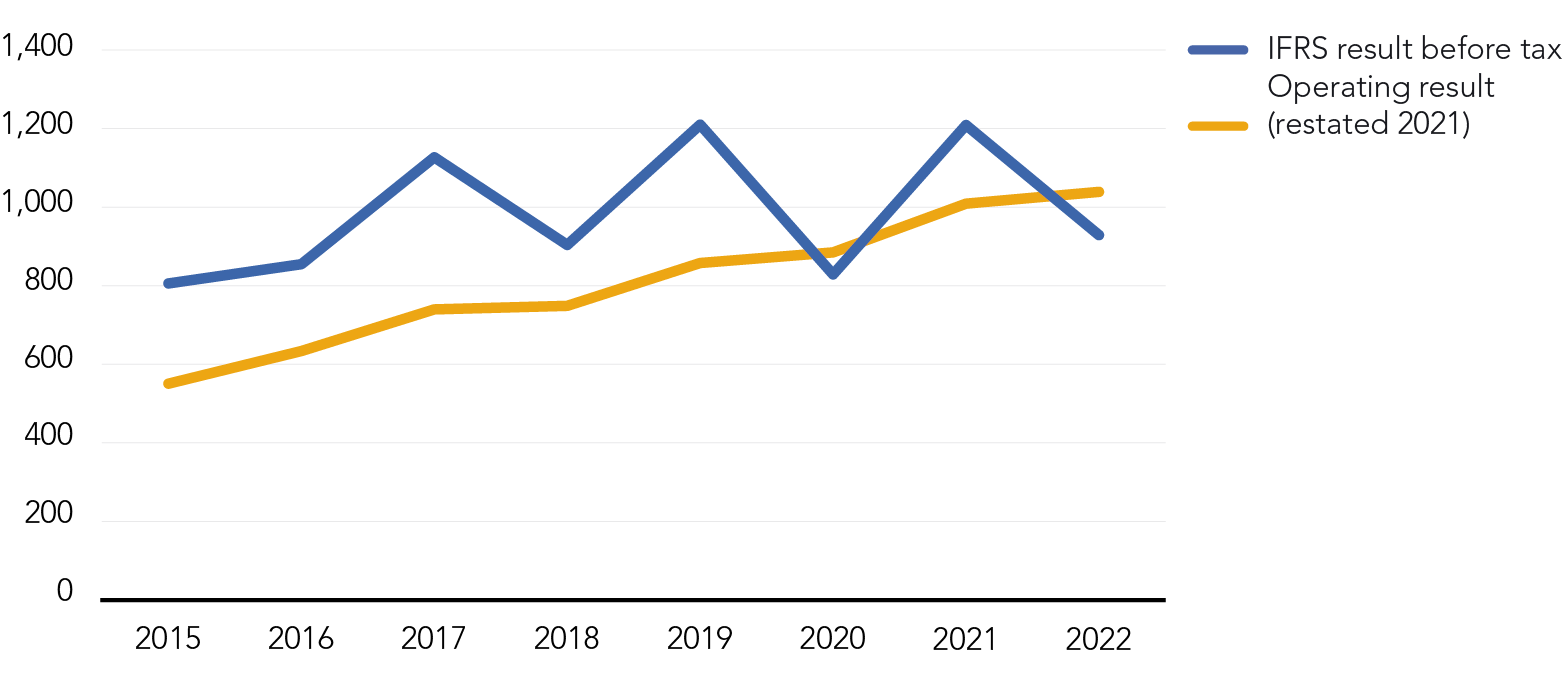
The seven-year comparison of the IFRS 4 result and the operating result shows that the IFRS 4 result for the year is more prone to volatility. In most years the IFRS result has exceeded the operating result. Only in 2020 and 2022, the operating result was higher than the IFRS result. The development of the operating results shows a steady increase as the business has grown. The presented IFRS 4 figures have not been revised and cannot be linked to the current financial statements due to the introduction of IFRS 17.
IFRS 17 result versus operating result
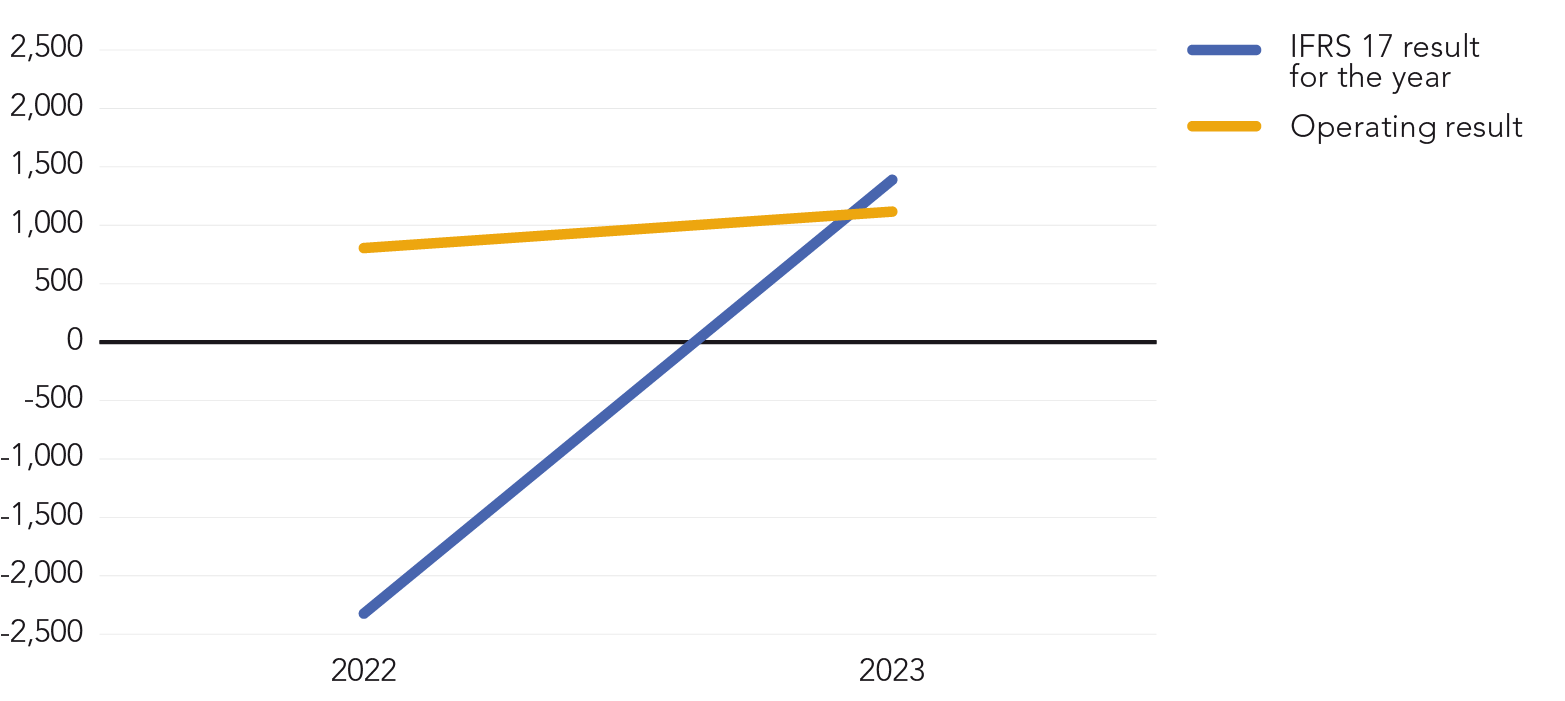
The two-year comparison of the IFRS 17 result and the operating result shows that, as expected, the volatility of the IFRS figures has increased significantly. In 2022 this was mainly driven by sharply rising interest rates resulting in significant revaluations. Operating result is less sensitive to financial market developments, as, amongst others, the Operating Investment and Finance Result is based on a standard return.
In 2023, IFRS result exceeded operating result mainly due to the downward adjustment of investment and finance result to the normalised operating investment and finance result (see below).
Reconciliation of IFRS result for the year to operating result
The reconciliation of the IFRS result for the year to the operating result is presented as follows:
| | 2023 | 2022 |
|---|---|---|
| Result before tax | 1,389 | -2,323 |
| Minus adjustments related to the insurance service result | -75 | -390 |
| Minus adjustments related to the investment and finance result | 579 | -2,694 |
| Minus adjustments related to the other result | -231 | -44 |
| | | |
| Operating result | 1,117 | 805 |
In 2023, adjustments related to the insurance service result (€ -75 million) mainly consist of the non-economic assumption update for inflation in the liability of incurred claims of Disability (€ -87 million).
Adjustments related to the investment and finance result (€ 579 million) were mainly related to fair value revaluations driven by decreasing interest rates in 2023.
Adjustments related to the other result of € -231 million mainly consist of the following items:
provisions made following the agreement with claim organisations on Unit Linked-life insurance transparency (see chapter 7.7.6.2). A provision was made of € 300 million in total, which includes an additional provision of € 50 million to facilitate individual claims of customers in distressing situations;
the purchase gain on the Aegon NL transaction (€ 153 million), see chapter 7.4.5;
the net positive impact from the Aegon transaction and the exchange of investment portfolios (€ 75 million);
restructuring provision expenses (€ -58 million);
amortisation of other intangible assets identified in business combinations (€ -23 million).
The negative IFRS result before tax in 2022 (€ -2,323 million) primarily reflected the negative investment-related incidentals (€ -2,694 million), related to significant revaluations driven mainly by sharply rising interest rates in 2022.
Adjustments related to the insurance service result (€ -390 million) mainly consist of future services on onerous contracts (€ -289 million) and strengthening of Disability provisions reflecting the 10% increase of the legal minimum wage as of 1 January 2023 (€ -93 million).
Adjustments related to the other result (€ -44 million) consist of regulatory project implementation costs (IFRS 17 and IFRS 9), amortisation of intangibles identified in business combinations, M&A costs related to the business combination of a.s.r. and Aegon Nederland and start-up costs for innovations.