

Dealing with climate change is one of the greatest challenges of this time. a.s.r. will step up its efforts towards a climate-neutral society. a.s.r. is aware of the importance of this and, as an insurer and investor, wants to play a role in the energy transition. This chapter, briefly describes how a.s.r. identifies, measures and manages climate risks and opportunities for its business in accordance with the Task Force on Climate-related Financial Disclosures (TCFD) recommendations. For a more detailed description, please see a.s.r.’s separate Climate and Biodiversity Report 2023.
Governance
For information on how governance is organised within a.s.r. on sustainability-related topics, including climate change, please refer to section 5.1.6. a.s.r. set up a TCFD project group to report in a structured way on its impact, dependencies, risks and opportunities related to nature. The scope covers the business units that expect to have the greatest impact and dependencies on climate. These are P&C, Disability and Health, Funeral and Individual life, Asset Management, Real Estate, and Mortgages.
Strategy
a.s.r. aims to have a prominent role in the financial sector when it comes to sustainable value. In order to do this, a.s.r. prioritizes three strategic themes, of which sustainable living is one. For the other themes, see section 2.1. a.s.r.’s climate policy is part of the sustainable living theme, and consists of four strategic pillars, through which a.s.r. manages the risks associated with its investments and insurance products, while at the same time aiming to contribute to solutions:
Incorporating climate risks into business processes;
Helping customers to prevent or reduce climate risks;
Stimulating the energy transition;
Contributing to sector initiatives.
For a.s.r., climate change is a direct and indirect risk to both its assets and its liabilities. At the same time, opportunities are also created for operating performance, including by helping customers reduce climate risks and facilitating them in the energy transition. This makes a.s.r. an insurer that moves along with the transition its customers are going through, which in effect means that a.s.r. is an attractive party to (continue to) house their assets and risks. More information on this and the four pillars of the a.s.r. climate strategy can be found in the Climate and Biodiversity Report 2023.
The following section describes how climate change affects a.s.r.’s product lines, how this is measured and how a.s.r. deals with it.
P&C
The impact of climate change on the insurance business is significant, according to a.s.r.'s own data and the Dutch Association of Insurers’ Climate Damage Monitor. These clearly show the impact of increasingly frequent extreme weather events due to climate change. Much of the damage caused by weather events is insured and therefore has a great impact on a.s.r.'s claims burden.
To manage these risks, a.s.r. analyses short-term and medium-term risks for insurance products using the Climate Damage Monitor. a.s.r. also calculates the long-term climate risks using sophisticated weather models of risk specialists such as Guy Carpenter and Gallagher Re. a.s.r. includes these calculations in the modelling and pricing.
To lower the risks, a.s.r. encourages its customers to take preventive measures in order to avoid damage and save energy, e.g. by providing tailor-made advice after inspection visits and by stimulating (sustainable) repair of damaged items. Furthermore, a.s.r. has included price incentives in its insurance products to encourage customers to take climate adaptation measures. Furthermore, a.s.r. works with annual contracts and can therefore make rapid adjustments if required due to physical climate risks such as changing weather conditions.
Disability and Health
Climate change may affect the development of disease and pandemics with potential implications for healthcare costs, absenteeism and disability. Therefore, a.s.r. has identified and estimated the main health risks related to climate change with an impact on labour and healthcare costs. A team of experts within a.s.r. monitors the development of (new) diseases due to climate change. Timely recognition and anticipation of risks affecting customers are important in the context of customer interests. The three medical conditions with the greatest potential impact on the cost of claims for healthcare costs, absenteeism and disability are expected to become more common as a result of climate change:
Increased airborne exposure to allergens from pollen, dust mites and caterpillars. Higher temperatures cause existing plants and trees to flower earlier and possibly more intensely. New species may also become established. Increases in air pollution and heat stress in cities amplify the aforementioned effect and lead to more lung disease;
Increased UV light will increase the incidence of skin cancer;
Zoonoses are infectious diseases that can spread from animals to humans. These can lead to the spread of (new) diseases, such as Lyme disease.
With today’s knowledge, the expected financial impact for the next 10 years seems limited because the increase in absenteeism or disability will mostly fall within the deductible period and the net effect on healthcare costs is limited due to the current health risk equalisation system in the Netherlands.
Funeral and Individual life
The effects of rising temperatures for Funeral and Individual life appear to be limited, due to the fact that most insurance portfolios have a short-term lifetime/premium cycle or will mature before the anticipated long-term climate changes might affect the risks insured. Future pricing can therefore most likely be targeted to an acceptable level of investment return. In the near future, more attention will be paid to analysing climate risks and making them measurable in order to target them for the Funeral and Individual life portfolio.
Asset Management
Since 2018, a.s.r. has validated its investment strategy by analysing the impact on various metrics in its Risk Appetite Statement due to climate change, based on climate scenario sets. a.s.r. has incorporated the impact of the different climate pathways on all assets managed for the general account for a.s.r. in the annual Strategic Asset Allocation study. In the analysis of this year an estimated impact on the liabilities of P&C in line with the impact estimated in the ORSA has been incorporated in the results. Also Aegon NL1 has been included.
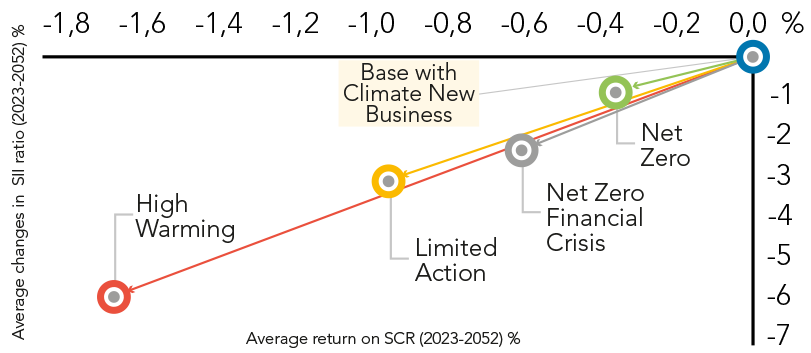
The impact of the four climate pathways on the Solvency II ratio and the average return on capital is limited. The main reasons for the limited impact are the European focus of the investment portfolio, the SRI policy and the dynamic investment policy. All of this results in a.s.r. investing less in countries, markets and companies that are hit harder by climate change and climate adaptation. The dynamic investment policy also provides for de-risking in the event of market stress due to climate change and thus supporting the overall solvency ratio.
The climate scenarios are a best estimate of the expected impact based on currently available science2 and data and may differ from future realizations.
The European Solvency II directive requires a.s.r. to assess all the risks it may face as an insurer. Based on this calculation, a.s.r. must maintain a minimum buffer to cover risks. The buffer is called the Solvency Capital Requirement (SCR).The return on the SCR reduces in line with failure to meet the Paris Agreement target. This is due to the direct impact of physical risks and, therefore, is also indirectly due to a decrease in return expectations under the different climate pathways;
Within the Paris disorderly scenario, abrupt sales of stranded assets are expected around 2025. This will cause a major financial crisis. The development of the solvency II ratio in that period is different, because of the dynamic investment policy and the SRI policy, a.s.r.;
In the limited action scenario, governments are attempting to avoid climate change, but efforts fall short of the goals of the Paris Agreement. Physical damages will be material world wide, but not as large as in a failed transition pathway. The impact for a.s.r. is also between a failed transition and Net zero scenario.
A failed transition to the Paris Agreement is a.s.r.’s largest risk. In such a case, the average SCR ratio will fall more sharply, in particular as a result of lower returns, due to physical risks.
Real Estate
Climate change poses risks to the built and rural real estate managed by a.s.r. Physical risks include inundation from large amounts of precipitation, but drought, heat and flooding can also cause damage. If climate change continues these incidental risks may become patterns. In the long term, this could result in changing demand for real estate and possible decreases in value for real estate susceptible to the effects of climate risks.
a.s.r. conducted comprehensive climate risk assessments for all properties in its portfolio based on the Framework for Climate Adaptive Buildings (FCAB). For more information please refer to chapter 3.2.2. The results of this analysis are used in decisions concerning a.s.r.'s real estate portfolio purchases, sales and maintenance. Of the investments in a.s.r.'s (urban) real estate portfolio (excluding rural), 1.9% of buildings have an increased risk of flooding and 0.5% have an increased risk of heat stress.
Attention is also paid to transition risks involving financial investments. For example, new legislation and regulations are being drawn up at the national and international level in the context of making real estate more sustainable and reducing chemical substances such as PFAS and NO2. In addition to applicable legislation and regulations, a.s.r. contributes to the energy transition and a sustainable living environment through investments in wind and solar parks.
Mortgages
Physical climate risks within the mortgage portfolio may be caused by damage to the underlying collateral due to climate-related events, which either lead to a decrease in the value of the collateral and/or affect homeowners’ ability to pay or repay their mortgages.
In line with the Real Estate’s approach a.s.r. uses the standard developed by the Dutch Green Building Council (DGBC): the Framework for Climate Adaptive Buildings to identify the relevant climate risks for the mortgage portfolio in the Netherlands. By combining data from the Climate Impact Atlas with portfolio data in the Geographical Information System (GIS) of a.s.r. Real Estate, a.s.r. can assess how vulnerable and sensitive locations in the Netherlands are to climate change. This data can be used to assess the risks of the collateral in the mortgage portfolio.
Drought, heat, storm and flood risks are considered. Some risks are covered by the building insurance that homeowners are obliged to have on a mortgage-backed collateral. The National Contingency Fund also covers some forms of climate risks (in case of a national disaster), which includes flood risks from primary waterways.
Two risk categories are not covered by any form of insurance: risks related to ground water and foundational damage due to drought. The risk assessment of risks related to ground water has updated compared to last year due to an amendment on the DGBC framework. There is virtually no or low risk regarding ground water risk for the a.s.r. mortgage portfolio. Foundational damage due to drought consists of pile rot and differential settlement. Of the a.s.r. mortgage portfolio, 5.5% is at high risk of one of these two risks. This estimation was made based on the location of the collateral. It is possible that measures have been taken by residents, thus reducing this risk. There are market-wide various initiatives to help people affected by this risk.
Risk management
As mentioned previously, risk management is an integral part of a.s.r.’s day to day business operations. The following describes a.s.r.’s approach to managing climate change risks. Climate change is a part of the strategic risks identified by a.s.r. To fully understand the potential physical and transition impacts of climate change on its business, a.s.r. has developed a top-down and bottom-up management approach.
The bottom-up approach revolves around the relevant business segments within a.s.r. developing measures and tools to identify and to mitigate identified climate-related risks or capture its opportunities. This ranges from portfolio construction, exclusions and engagement within asset management activities to underwriting taking into account climate risks, client engagement and developing new products and services.
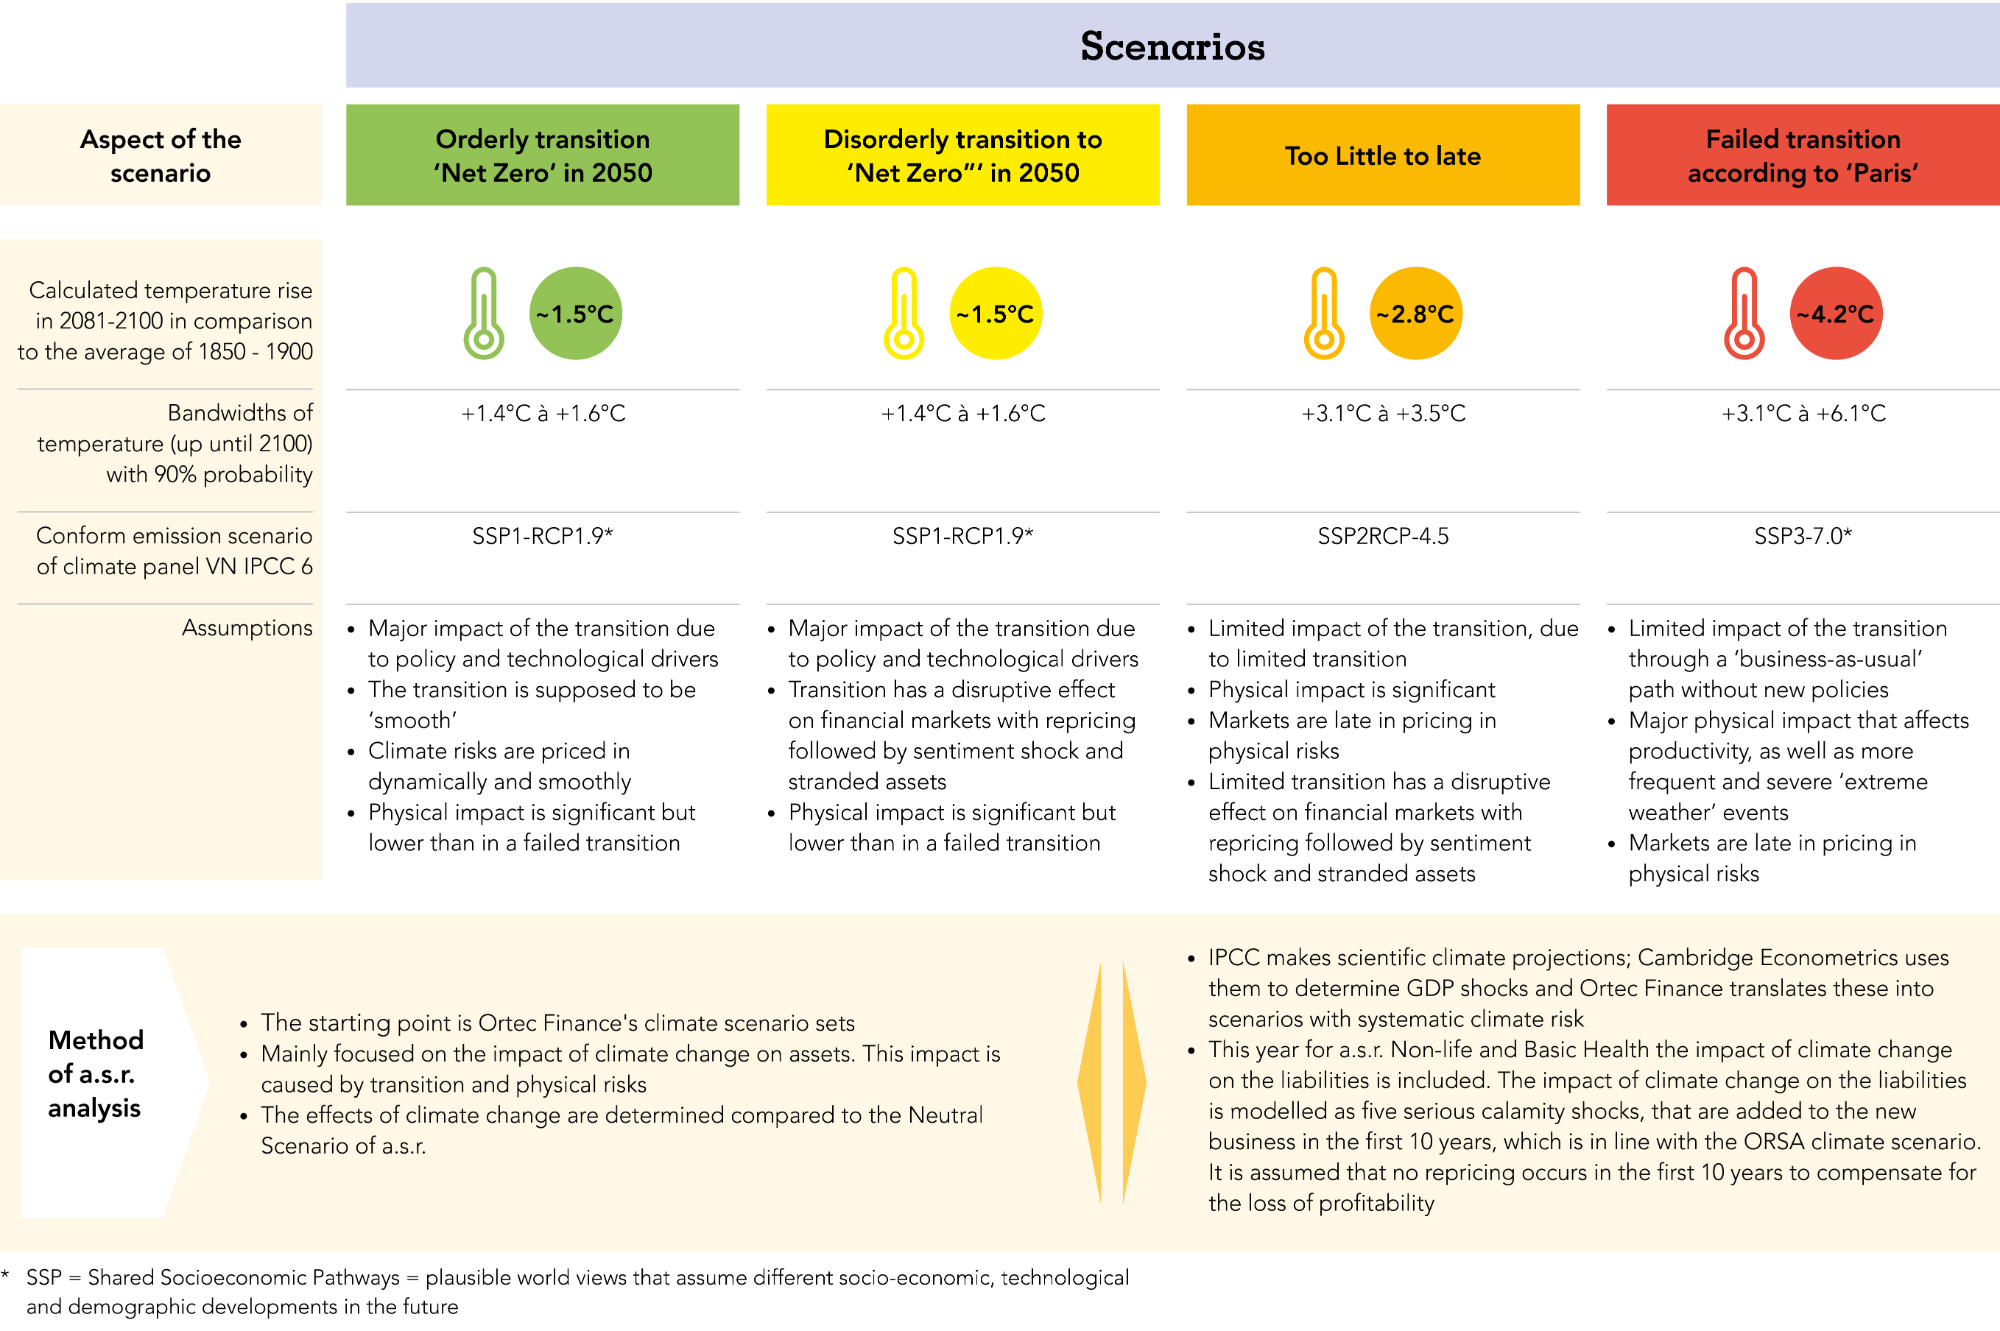
In the top-down approach, a.s.r. analyses the impact of four climate scenario-driven insights into the resilience of the business, mainly focused on the impact of climate change on assets. These are attained using four climate scenarios with a 30-year horizon based on the Strategic Asset Allocation (SAA) model.
The Climate Risk Monitor was developed to manage climate risks within the urban property portfolio. This is an analysis tool for decision-making in acquisitions, disinvestments and portfolio maintenance. The Climate Risk Monitor contains building-specific data combined with climate data from the Climate Effect Atlas. These datasets are then combined in the GIS to generate cartographic layers that provide a quantitative insight into the level of risk per asset. By 2021, the climate dataset was embedded in the business processes.
A risk analysis was also carried out for the mortgage portfolio on the basis of the climate effect atlas in order to generate insight into the risk areas for flooding, for example. Because mortgages at a.s.r. can run for up to 40 years, it is important to have insight into the long-term risks for this portfolio.
For the P&C portfolio, Ortec calculated the long-term climate risks for the P&C portfolio in the 3 different scenarios (low, medium, high).
Overall, climate risks as a result of climate change and the energy transition are incorporated into a.s.r.’s risk appetite and part of the regular risk management processes, such as the annual group-wide SRA process. Material climate risks identified in the SRA process, including storms and floods, are incorporated into the scenario analysis of the Own Risk and Solvency Assessment (ORSA) and quantified by the business actuary teams. With life and health insurance, the impact is mainly in the longer term and is not quantified in the ORSA horizon of 5 years. Transition risks apply in particular to investments and financing The ORSA assesses the overall solvency needs of a.s.r. in the context of the strategic plans, making allowances for the current and expected solvency positions, the risk appetite and solvency targets.
The figure on the next page provides an overview on the different climate pathways.
Metrics and targets
a.s.r. believes it can make a positive impact through a sustainable investment policy and by developing insurance products and services that support the energy transition and help customers adapt to climate risks. In addition, a.s.r. continuously works to reduce its own (indirect) negative impact. The climate metrics and targets are shown in the table below.
| (units specified below) | Target | Note | 2023 | 2022 |
|---|---|---|---|---|
| Impact investments (in € billion) * | € 4.5 billion in 2024 | 3.2 | 4.0 | 2.8 |
| Reduction of carbon footprint of investment portfolio (in %) * | 65% in 2030 (base year 2015) | 3.2 | 69.4 | 65.2 |
| Reduction of carbon footprint in the insurance portfolio (in %) | 26% in 2030 (base year 2022) | 3.1.1 | 0.1 | n/a |
| Reduction of carbon footprint of operations at a.s.r. (in %) | 50% in 2025 (base year 2018) | 3.5.1 | 52 | 62 |
| (units specified below) | Note | 2023 | 2022 | 2021 | 2020 | 2019 |
|---|---|---|---|---|---|---|
| Energy (in kWh) | 3.5.3 | 8,218,739 | 8,424,604 | 8,403,718 | 7,211,643 | 8,431,307 |
| - Wind electrical energy (purchased) | 3.5.3 | 4,414,782 | 4,363,046 | 4,649,449 | 4,458,798 | 5,710,499 |
| - PV electrical energy (solar panels) (self-generated) | 3.5.3 | 827,157 | 917,958 | 363,369 | 161,045 | 152,808 |
| - WKO (renewable heat and cooling) (self-generated) | 3.5.3 | 2,976,800 | 3,143,600 | 3,390,900 | 2,591,800 | 2,568,000 |
| Natural gas (in m3) | 3.5.3 | - | - | - | - | 18,311 |
| | | | | | | |
| Renewable electricity solar panels (in % to total electricity)1 | 3.5.3 | 15.8 | 17.4 | 7.2 | 3.5 | 2.6 |
| | | | | | | |
| Energy consumption (kWh per m2) (purchased) | 3.5.3 | 48 | 47 | 51 | 49 | 63 |
| Energy consumption (kWh per m2) (purchased and self-generated) | 3.5.3 | 89 | 92 | 91 | 78 | 94 |
- 1 As of reporting year 2023, a new and cleaner method is applied for calculating the renewable electricity share of solar panels to the total electricity used. The comparative figures are corrected accordingly.
| (in %) | Note | 2023 | 2022 | 2021 | 2020 | 2019 |
|---|---|---|---|---|---|---|
| Car use | | 60 | 60 | 73 | 60 | 59 |
| Bicycle use | | 20 | 22 | 23 | 21 | 22 |
| Public transport use | | 21 | 18 | 4 | 17 | 16 |
| Carpool | | - | - | - | 2 | 3 |
| Total | | 100 | 100 | 100 | 100 | 100 |
| | | 2023 | 2022 | 2021 | 2020 | 2019 | |||||
|---|---|---|---|---|---|---|---|---|---|---|---|
| (units specified per column) | Note | in % | tCO2 | in % | tCO2 | in % | tCO2 | in % | tCO2 | in % | tCO2 |
| Fuel and heat | 3.5.3 | 0.1 | 4 | 0.1 | 3 | 0.2 | 3 | 0.3 | 8 | 0.5 | 37 |
| Cooling | 3.5.3 | 0.9 | 35 | 1.2 | 35 | 2.0 | 34 | 1.3 | 37 | 0.7 | 51 |
| Business travel as a result of lease car fleet | 3.5.3 | 14.5 | 558 | 24.6 | 745 | 43.1 | 748 | 40.8 | 1,113 | 26.5 | 2,078 |
| Scope 1 | | 15.5 | 597 | 25.9 | 783 | 45.2 | 785 | 42.4 | 1,158 | 27.7 | 2,166 |
| | | | | | | | | | | | |
| Scope 2 (market based approach) | | - | - | - | - | - | - | - | - | - | - |
| Scope 2 (location based approach) | | n/a | 2,013 | n/a | 2,282 | n/a | 2,585 | n/a | 2,479 | n/a | 3,706 |
| | | | | | | | | | | | |
| Business travel excluding lease car fleet | 3.5.3 | 6.4 | 247 | 4.9 | 148 | 3.3 | 57 | 3.2 | 87 | 4.2 | 329 |
| Commuter travel | 3.5.3 | 73.6 | 2,840 | 65.4 | 1,984 | 48.0 | 833 | 51.6 | 1,408 | 66.0 | 5,148 |
| Waste | 3.5.3 | 4.6 | 176 | 3.9 | 119 | 3.5 | 61 | 2.8 | 76 | 2.1 | 160 |
| Scope 3 | | 84.5 | 3,263 | 74.2 | 2,251 | 54.8 | 951 | 57.6 | 1,571 | 72.3 | 5,638 |
| | | | | | | | | | | | |
| Total (market based approach) | | 100 | 3,860 | 100 | 3,034 | 100 | 1,736 | 100 | 2,728 | 100 | 7,804 |
- 1 The figures are based on a.s.r.’s head office (91,912 m2 gross floor area). The offices in Enschede (1,830 m2 gross floor area), Rotterdam (approx.1,000 m2 gross floor area of office space and 3,900 m2 gross floor area of archives) Heerlen (2.815 m2 gross floor area) and Hoorn (3.745 m2 gross floor area) are not included.
- 2 According to the Greenhouse Gas Protocol.
| (units specified per column) | | 2023 | 2022 | 2021 | 20151 | |||
|---|---|---|---|---|---|---|---|---|
| | Note | Reduction in %2 | tCO₂ / € 1mln | Reduction in %2 | tCO₂ / € 1mln | Reduction in %2 | tCO₂ / € 1mln | tCO₂ / € 1mln |
| Equity | | 68.4 | 42.9 | 66.4 | 45.7 | 72.4 | 37.5 | 136.0 |
| Credits | | 78.1 | 47.6 | 76.8 | 50.6 | 74.8 | 55.0 | 217.9 |
| Sovereigns | | 63.4 | 58.9 | 57.2 | 69.0 | 40.5 | 96.0 | 161.3 |
| Asset Management | 3.2.1 | 71.7 | 52.1 | 67.8 | 59.2 | 59.7 | 74.2 | 184 |
| | | | | | | | | |
| Real estate | 3.2.2 | -7.5 | 137.8 | -17.0 | 152.0 | -18.6 | 154.0 | n.r. |
| | | | | | | | | |
| Mortgages | 3.2.3 | 63.9 | 7.5 | 62.6 | 7.7 | 58.1 | 8.6 | 20.6 |
| | | | | | | | | |
| ASR Nederland | | 69.4 | 47.3 | 65.2 | 54.3 | 56.6 | 67.8 | 141.8 |
- 1 The % carbon reduction of investment own assets figure is calculated relative to baseline year 2015. Real estate has been added to the scope since 2019. The impact of the addition of Real estate in 2019 on the % carbon reduction of investment own assets figure has been corrected for using an indexation method. It is noted that Real estate has not contributed to the % carbon reduction of investment own assets realized in the period 2015-2019.
- 2 % reduction compared to baseline year. For more details about this non-financial strategic target, refer to 8.1 About this report.
| | | 2023 | 2022 | ||||
|---|---|---|---|---|---|---|---|
| | | Total | Provincial | Mandated agents | Direct channel | Total | |
| | Note | Reduction in %1 | tCO2 | tCO2 | |||
| Private passenger | | 2.4 | 116,796 | 27,794 | 83,194 | 5,809 | 119,663 |
| Business | | -5.8 | 49,783 | 27,966 | 21,818 | - | 47,060 |
| Total | 3.1.1 | 0.1 | 166,579 | 55,760 | 105,012 | 5,809 | 166.723 |
- 1 % reduction compared to baseline year 2022. For more details about the target on insurance related emissions, refer to 8.1 About this report.
- 1Aegon Leven N.V. and Aegon Spaarkas were acquired by a.s.r. in 2023 and use the partial internal model in the analysis.
- 2The incorporation is of the climate science and data into the climate scenarios is performed by Ortec Finance.